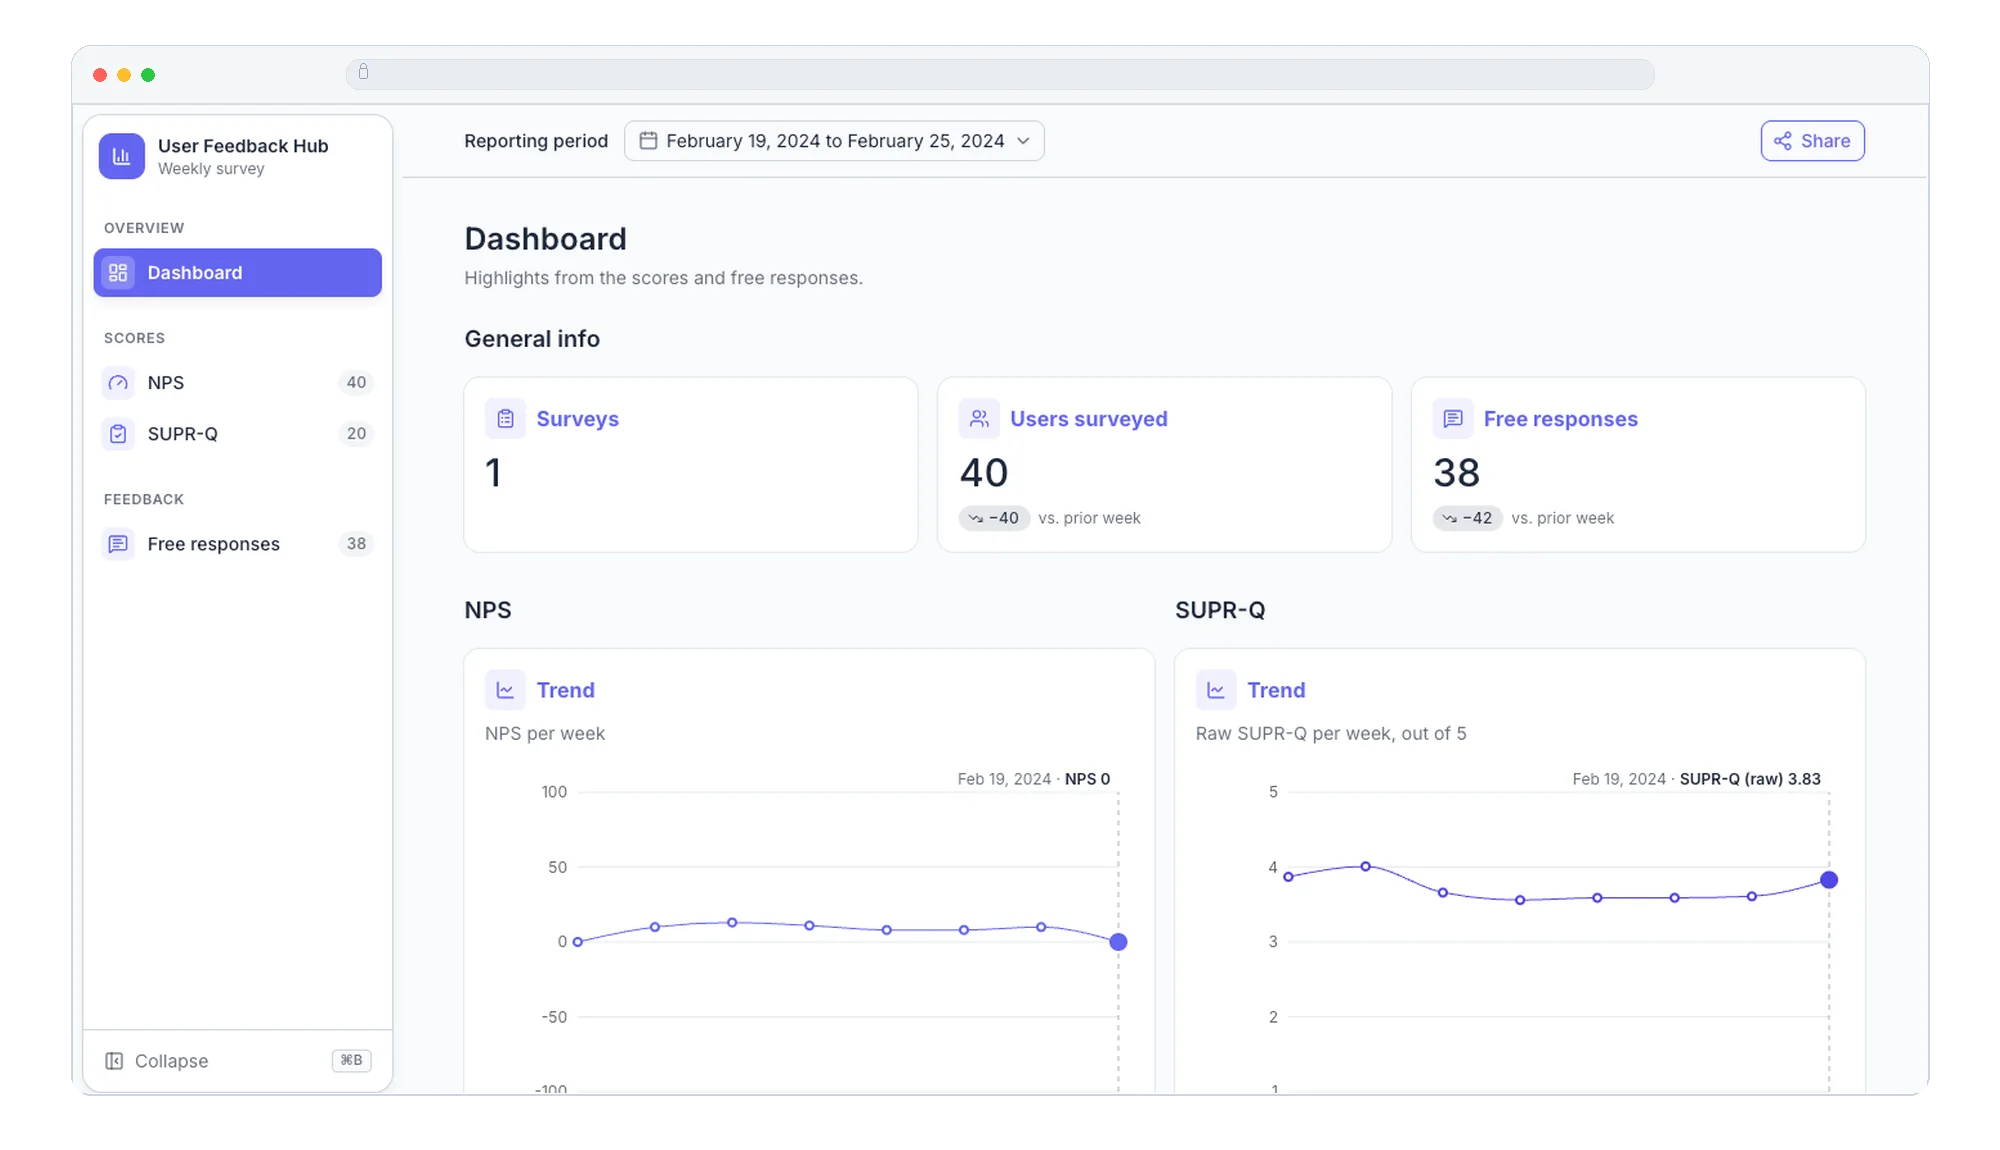
Customer feedback often lives across survey tools, spreadsheets, and team conversations. Scores can show that something changed, but finding the comments behind that change takes more work. I explored how I would bring those signals together in a workflow that makes feedback easier to review, investigate, and share.
The approach
I created a custom skill that organizes survey data, calculates scores, and proposes sentiment and theme tags using a shared taxonomy. It presents the results for my approval before they reach the dashboard. I believe strongly in keeping a human in the loop: reviewing the output helps catch errors, clarify ambiguous comments, and identify themes the taxonomy misses.
I also built a functional dashboard prototype to explore how people could use the approved data. It brings scores and written responses into one place, with views for overall trends and individual survey types. Users can select a reporting period, compare weeks, filter by sentiment or theme, search original responses, and share a link to a filtered view.
Key design decisions
- Keep the original responses accessible. Scores and tags help people spot patterns, while source comments let them check the evidence.
- Support both guided and open-ended exploration. Theme filters answer recurring questions; search helps uncover issues the taxonomy does not yet capture.
- Show the distribution behind a score. Breakdowns of NPS and SUPR-Q responses provide more context than a single headline number.
- Make sharing part of the workflow. A filtered link lets someone pass along the exact view behind an observation.
I refined the prototype’s navigation, reporting-period selector, and visual hierarchy so someone could move from a high-level signal to the relevant responses with less effort.
Toolkit
- ChatGPT: Brainstorming the approach and creating the initial skill.
- Paper and Figma MCP: Exploring design options and fine-tuning the interface.
- Claude Code: Building the app and the workflow that moves approved skill output into the Supabase-backed dashboard.
- Supabase: Hosting the prototype’s data.
Data protection
For the working prototype, I used Supabase to host the data. For a production version, I would work with the engineering team to choose a protected server and appropriate access controls for customer feedback.
Next steps
I would explore how to bring other sources of customer insight into the same interface, including user interviews, support tickets, and conversations with customers and account managers. That would let teams investigate themes across different types of feedback, while retaining a way to trace each insight back to its source.
Together, the skill and dashboard demonstrate a possible end-to-end workflow, from organized and reviewed survey data to insights people can explore for themselves.